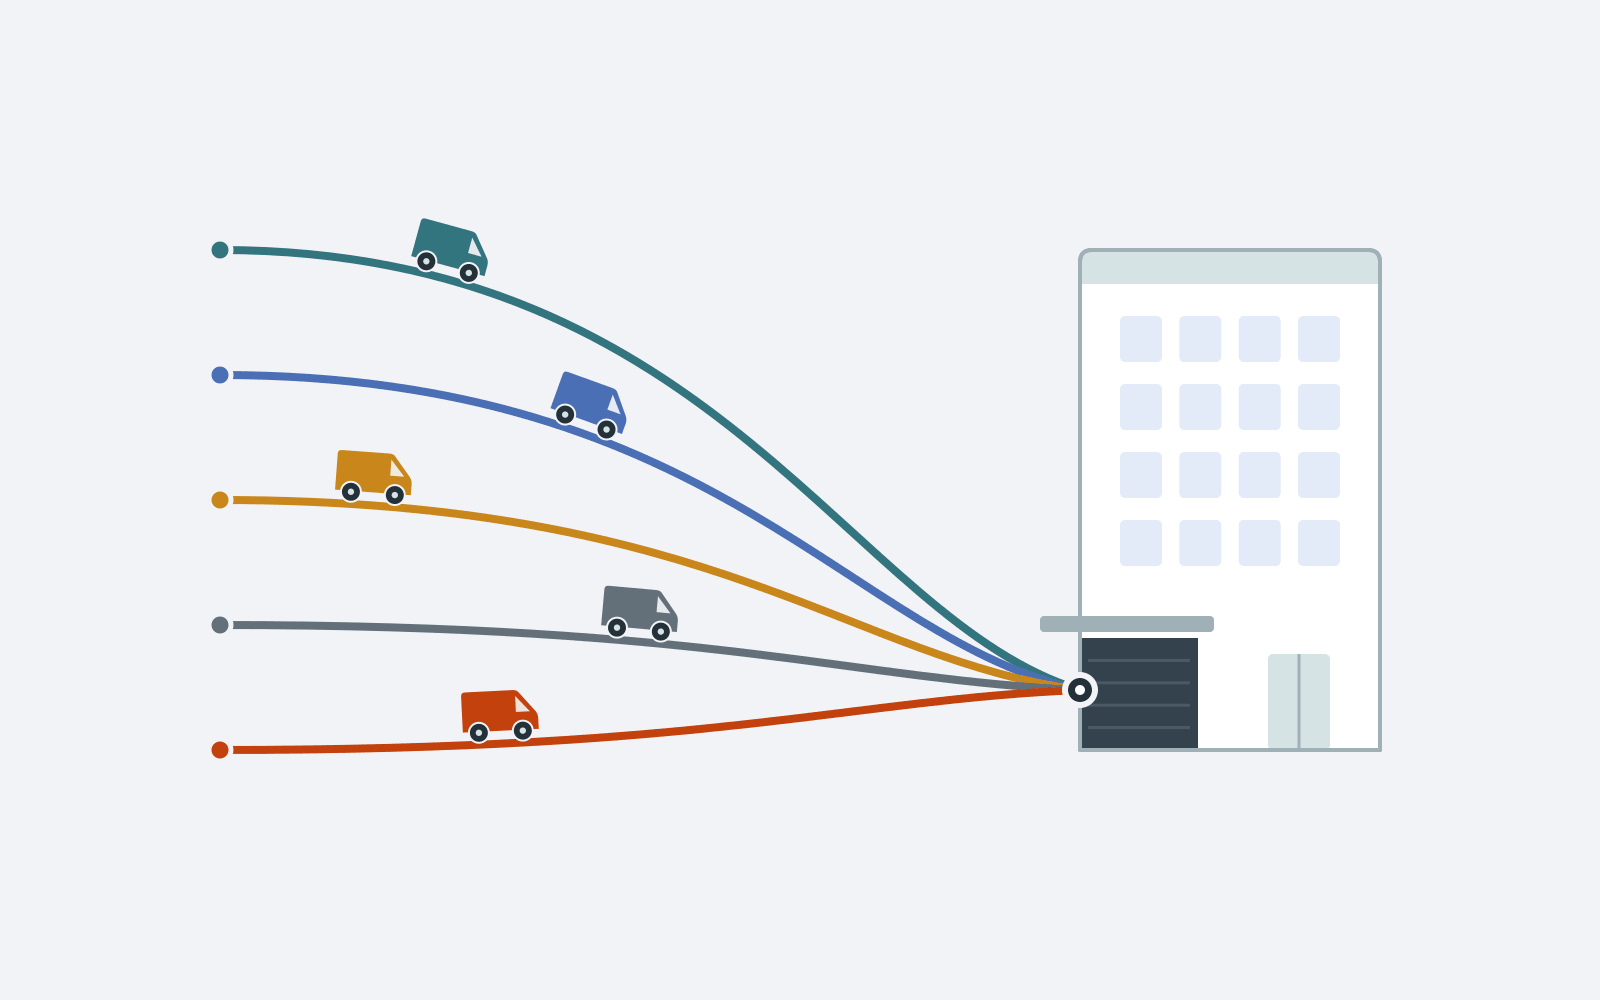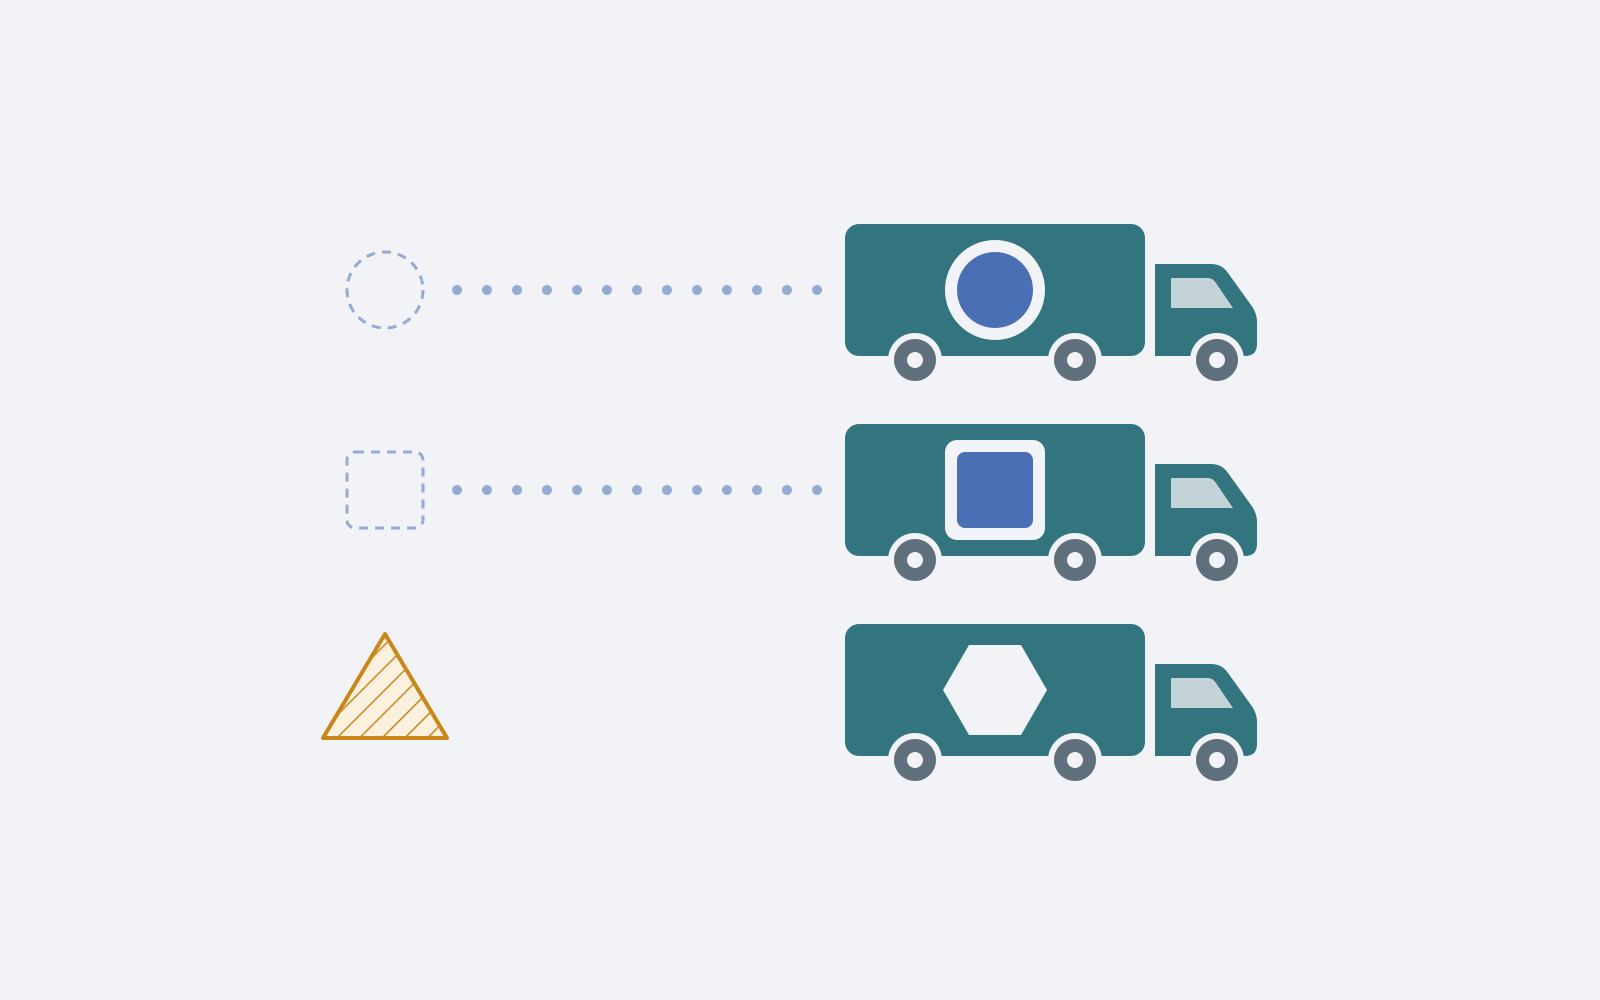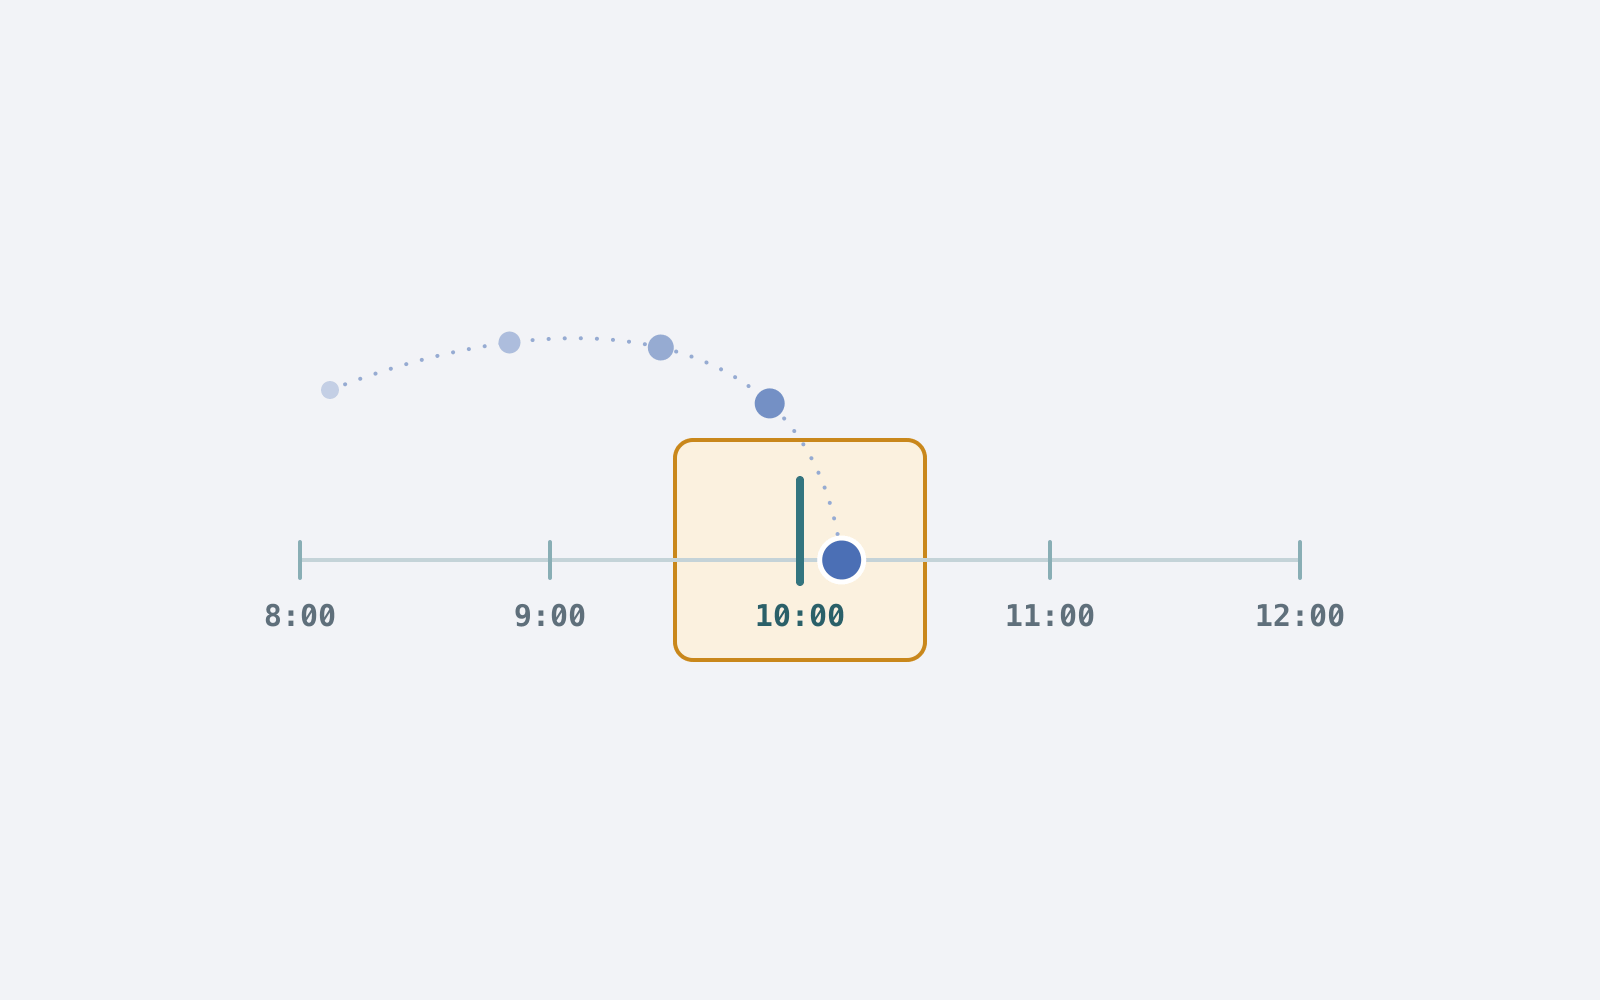
Anyone who gives an arrival time makes a promise. Others plan around it: the ward, goods receiving, the warehouse preparing the next load.
An arrival time is quickly calculated. Along the planned sequence, you add up the travel times between the stops and the times at the stops. That does not yet make it reliable. For that, each of these parts has to be right, and not on average, but at the moment the vehicle is actually on the road.
Two errors that cancel out
In an evaluation of delivery punctuality we found two opposing errors. Travel time was planned too tight, the time at the stops too generous. At tour level the two largely cancelled out. The tour ended roughly on time, while every single point in time within it was wrong. That is exactly why it went unnoticed for a long time.
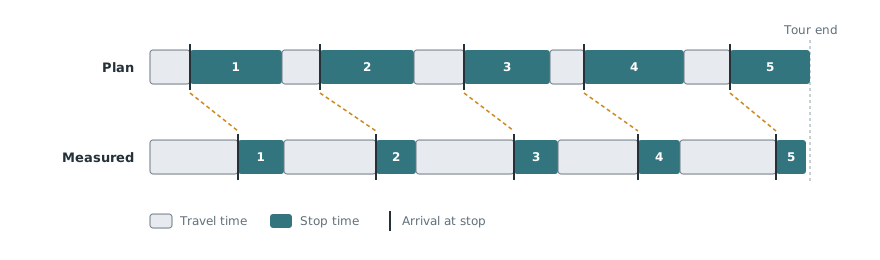
A simple rule follows from this: measure per part, not per tour. Anyone who only compares the end of the tour does not notice whether a change makes the model better or worse.
A punctual tour is not yet a punctual delivery.
Travel time: traffic at the right time of day
The travel time between two stops depends on when the vehicle drives that stretch. A trip planned at nine that takes place at eleven meets the traffic of eleven. The speed measured right now therefore does not yet answer how long the trip will take later.
NUNAV therefore plans travel times with the traffic expected at the time of day in question. They rest on NUNAV's traffic forecasts; how these come about is described in the article How NUNAV combines traffic forecasting and route coordination. Once the tour is running, current traffic is added.
Stop time: measured rather than estimated
The second part is the time at the stop. It is hard to estimate because it differs a great deal from place to place. A parking space has to be found, the goods unloaded, the way to receiving walked and the handover completed. In a hospital there can be a long corridor between the dock and the ward; at the pharmacy round the corner, a single step.
NUNAV measures stop time from the positions of the driver app. As soon as the vehicle parks, the stop begins; as soon as it drives off again, it ends. The planned stop time at an address adapts to the most recently measured visits. An address where unloading regularly takes longer thus gets more time in the plan, without anyone having to maintain it by hand.
During the tour
Once the tour is running, measurements are added. The driver app reports the position and completed stops. The forecasts for the following stops are updated, and if an order is added or dropped, the running tour can be recalculated.
A distinction that often blurs in daily work is worth making here. There is the plan at the time of release, the time someone was promised, the live expectation during the drive and the actual arrival. NUNAV keeps these four times apart. The arrival is measured. The expectation is derived from how the tour has gone so far. What is promised is a decision.
How certain is the forecast?
A single clock time says nothing about how certain it is. A time window that matches the actual uncertainty is more reliable.
For this, NUNAV learns per depot how far actual arrivals deviate from the planned times. The model does not change the forecast itself: if the plan says ten o'clock, it stays at ten o'clock. What is learned is how wide the window around that time has to be for it to hold with the desired certainty.
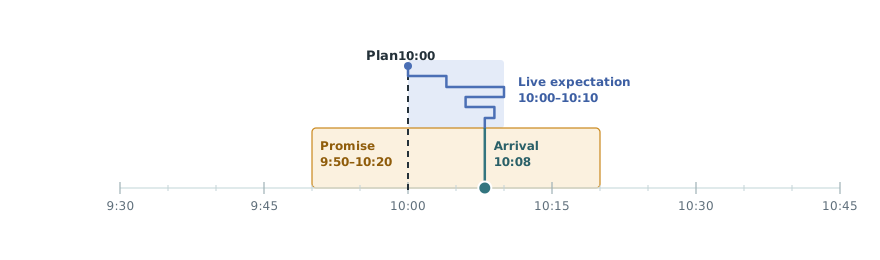
Before any time is promised at all, NUNAV checks whether the tour is fit for it: whether it has been released, whether the vehicle's position is current and whether the plan is recent enough. If the arrival later moves out of the promised window, the promise is corrected. If its basis falls away, for instance because no positions arrive any more, it is withdrawn.
The return to the depot
For the warehouse, not only the last delivery counts but also the return. Knowing when a vehicle will be back means the next load can be prepared in time. In NUNAV the end of the tour at the depot is a planned point in time of its own and is updated with every recalculation. An explicit message such as “on the way back” to the warehouse system is connected in the project through the interfaces.
Who is told the time
Dispatch sees the forecasts on the map and in the tour overview. Anyone expecting a delivery can look up the arrivals on an arrival board. Connected systems receive promises, corrections and withdrawals as signed messages through an interface. We define further notifications in the project, for example to particular audiences or as an alert on standstill with an escalation chain, and connect them through the same interfaces.
The decisive question
For arrival forecasts, it therefore matters less whether a time is right to the minute. The more important question is: does the forecast know how certain it is?
How we support you
Reliable forecasts grow out of your own tours. We accompany the introduction in three steps:
- Taking stock: How well do planned and actual times match today, separately for travel time and stop time? We evaluate the tours actually driven.
- Settings: Together we decide who is promised which times, from when on and with which window.
- Operation: Deviations stay visible, and the models keep learning from every tour driven.